Friday, April 16, 2010

Market Talk

For long-only portfolio managers today's market set-back might be bad news but for active traders such as ourselves it was a wonderful shake-up of volatility. We wrote in our newsletter last night, "What's keeping us sane in this insane market is simply not thinking about it too much, making jokes, and trading the set-ups. That's it." The frustration was audible.

Even though we shorted today (FCX through trend-line whose chart we posted on our account and some fun with SPY) we also traded long on support (GG AEM CNQ SU) and will be looking at long support set-ups for next week.

Bullish sentiment as strong as the one we have been swimming in does not die this easily (AAPL closed down 0.54%!) and for now we believe support long trades will work well and that will be our focus-- until proven otherwise.

For the first time in a while we'll be looking forward to writing the newsletter this weekend. Thanks Goldman!

As an aside we couldn't agree more with Reformed Broker's Post
"Spare me the Outrage"
.

Cynical? Yes. But alas so is the reality of Wall St.

Wednesday, April 14, 2010

Ag talk

Ferts have been stinking up the joint for a while but today looks like bottoming action. For you value type dudes entries here with stops close to today's lows offers a good risk-reward trade.

Note how the price action has been pricing in today's downgrades for weeks. Never ceases to amaze us how irrelevant analysts have become. We wrote a while back on the RIMM break-out that the least successful break-outs occur due to upgrades (best are earnings), and most likely it holds that the most successful bottoms are on analyst downgrades.

MOS held the 200SMA


CF again held the 200SMA


AGU found footing on the 100 SMA

EMA strategy for buying support

Here are the charts we posted real-time on the GMCR trade. It wasn't a big win but it's a decent strategy we use for buying support and it was fun discussing it real-time (and was satisfying seeing traders make some money in it).

Most traders are aware of buying dips on trending stocks in the  stock market on the 20EMA/5 minute chart. We do that all the time and it works very well. One less common strategy  is to look for stocks that have bottomed, make higher lows, flatten under the EMA, and then buy through the EMA with stop under the higher low. Let's take a closer look at the charts we posted today.

The first chart is one we noticed on GMCR weakness on the daily chart. Stock was hugging the trend-line again and we were looking to see whether it would get downward pressure.


Stock broke through the trend-line but bounced right on top of a mini-support right under it. In a market as strong as this one our main focus has been long, be it break-outs or support longs, so we were interested.


Here's a closer look of the support right under the trend-line. Typical head-fake under trend-line shaking out weak holders.


Stock made higher low which was good -- next step was to base under the EMA and stop it from trending down. Flatten the EMA and through was what we were looking for.


We got the start of the move through the EMA and as we posted real-time, we started buying.


After that the point is to adjust the stop, always just below the EMA or if you want to make sure not to get head-faked, then a closing candle under the EMA.


As we posted when GMCR was at 96, we took off all the day-trade size but left on a small swing trade with stop above entry over 95.2. This is a "house money" trade that we'll keep on with little risk in case stock wants higher in the next few days.

Again, not a big trade, but a close, real-time, look at how to use the 20EMA to help buy support.

Tuesday, April 13, 2010

Pattern Discussion

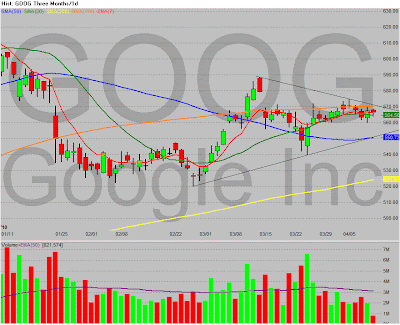
We first started posting the GOOG pattern on April 10, on chart.ly:


This was the chart:


And this is today:


One of our favorite patterns is the break of the symmetrical triangle. And what's the best action right before? Stock bases in the upper range right below the trend-line. This gives the added strength to the pattern of a stock jumping from a mini-base within the triangle pattern and the added safety of using the base as a stop if the break-out fails. Keep that detail in mind next time you are looking for a triangle break-out.

Tuesday, April 06, 2010

Triggers

The better the base from which a stock breaks out the longer our holding time. However, ff a stock breaks out from extended level then we either go in for a day-trade pop or we look to short the failure, again for a quick daytrade.

Yesterday we had break-out triggers on AA AIG but we also had a list of short candidates on break-out failures:

AA was a traditional break-out alert at 14.8-14.85


AIG was good for a fast trade with our alert from last night at 35.6-35.7


We wrote that more experienced traders could look to short break-out failures on the following:

APC 75 reversed at the alert number


CNQ 80 reversed at the alert number


HAL 32 went through the alert near the open but reversed at R1


NEM 54 break-out failure


Why did we add a list of break-out failure candidates? Because most of the time if we can't find too many good break-out set-ups in our scans then the market often is in need of rest or will chop around.

Saturday, April 03, 2010

Terminology

Every week we get a request to forward an old newsletter that we wrote about terminology. The charts (and dates we refer to) are dated but the methodology is the one we've used for the last decade and most likely will use until we retire.

This is how we use basic support and resistance:

----------------------------------------------------------------------------

Some of you wanted more clarification in how we use our terms.

a) Break-out (long through the break of resistance)
b) Support long (trade with the plan that support holds)
c) Break-down short (short through the break of support)
d) Resistance long (shorting the reversal of a stock against resistance)


Here is an alert from a few weeks ago, WYNN 70 long which was a break-out long through daily resistance: 70 was previous resistance but we believed that it would go through this time -- a successful break-out through 70 resistance


A support long -- we believed that support would hold (and not crater) due to AKS being over-sold (extended from any base on daily).


AKS 20 is a potential support short (your traditional break-down short with the belief that support will crater). If volume is good we would short 20 and hopefully cover on the 200 SMA near 19. Why not buy 20? Because of the base.


GS today was a resistance short -- that is instead of breaking out of resistance to be a successful break-out long we believed last night that it instead would reverse at resistance.


--------------------------------------------------------------------------------

Intraday set-ups:

Base and break can be either short or long -- it simply means a basing over the alert for shorts, or under the alerts for long. Base and breaks are used for break-out longs (through resistance) and break-down shorts (through support). Here is a base and break of the QQQQ short from the daily spot 44:


Daily spot was 44 -- bases right above and goes through for what would have been a very successful short through 44 support.


Extended from EMA is the opposite of base and break and is used for support longs and resistance shorts.

GS resistance short alert from last night at 160 a good example -- GS approached 160 extended from base and thus was ripe for a reversal short trade against resistance.


Another example of extended from base resistance short on our ANR trade today:

Base was near 43.2 -- note how extended it was by the time it hit daily resistance at 44. The short was a lay-up.


Here is an example of a support buy long from MET today as stock reversed up after hitting the 200 SMA


Text-book set-up for support long as the stock hit daily support in an extended fashion -- base was 34.8, stock went down at a steep angle, hit support on daily, and bounced.


Most trading strategies are based on some type of Support and Resistance -- our niche is to combine daily support/resistance with intraday strategies (base and break/ extended away from base).


For break-out longs/break-down shorts use base and break
For support longs/resistance shorts use extended away from base
Note how the two are the exact inverse of each other.

As to whether day-trade or swing these trades the formula is simple: if you're going contra-trend (stock extended hitting resistance but in strong trend) then only day-trade. If you're going with the trend (break-out on high-volume in direction of trend) then swing.


Hopefully this helps clarify the matter.


HCPG

Tuesday, March 30, 2010

Protect Mode

We posted yesterday before the close that we were going down our alert list and buying everything within 1%. It worked well as several of the stocks gapped over (including our favorites VALE FCX).

However we believe now that this will be it for break-outs for at least a few days. We sold a lot into this ramp and now have stops over entry for remainder of positions.

Monday, March 29, 2010

Market Talk

Very bullish day for the market as we saw rotation into the commodity stocks as leader sectors like financials took a breather.

Let's look at a few charts we always keep on our screens:

AAPL is probably the most symbolic market leader and the stock keeps melting higher.


As we posted a few times today GS made a perfect bounce on the 20SMA as the bulls defended the spot with vigor. Watch today's low as a tell for market sentiment. If GS breaks through today's lows with volume then we would probably go back to a more conservative stance.


Copper often is a great tell and today it made a very nice bullish move.


So far everything looks good to go for higher prices. If the market wants to roll over for a prolonged correction then most likely the three charts we mentioned will lead the way. We'll stay on the bullish side for as long as these three are healthy.

Thursday, March 25, 2010

Position Update

All we're doing these days is buying whatever alert sets up well, daytrading part of them, and holding rest swing -- we're still long swings from a few days ago including CAT (alert was 60.5), DE (alert was 60), FLS (108 not in newsletter but we tweeted), AAPL (alert 226), MDR (alert 26), VALE (tweeted yesterday, in at 31.33 in anticipation of 32 breakout), BG (alert 64), NUE (in today 46.07 in anticipation of 46.5 break-out), GS (alert 178 entered today), CAGC (alert 28 entered today), BCSI (alert 33, we've held this through a re-test, slightly underwater but small position left which we'll sit on), and SWK (added today to position small swing average 59.19 in anticipation of 60 break-out), and CREE added today (alert was 72).

We're also long AIG 34.42 average for a trade with stop trailing under 20EMA.


-----------1:30 PM update: we are systematically taking profits and raising cash as we have many positions on and no hedge. We also sold the AIG for a point and raised stops on all our positions.

-----------Selling most of positions added today on breaks of the 20EMA/5 min chart

------------Sold everything except for the following: CAT FLS DE MDR AAPL VALE NUE GS.

----------March 26 update: Sold MDR NUE FLS DE CAT into the rally and only have AAPL GS VALE left in swing positions.

----------Sold reamaining three positions, all cash for the weekend.

Tuesday, March 23, 2010

Break-outs

Yesterday our support alerts worked great -- today the breakouts are working. What more could a trader ask for?

Every break-out that triggered from our newsletter last night worked:

AAPL looks like it is revving up for higher prices -- 220 is the line in the sand that has to hold.


BCSI has been on our list for a while for a break-out through 33.


We added BG 64 yesterday for a very nice break-out today.


CAT 60.5 finally triggered for a nice breakout here.


We mentioned yesterday afternoon that DE had hit our 60 alert but had travelled all the way from support to resistance and was possibly out of ammo -- and therefore we were swinging. We sold partial swing into today's rally.


MDR has been on our list for a while for a break-out of 26 which we finally got today.

Monday, March 22, 2010

Support

We had six stocks trigger at or near our support alerts at the open. When support is triggered in multiple stocks at the same time it usually holds -- similar to cluster break-outs in sectors.

These are the new lines in the sand that now have to hold (AAPL 220, RIMM 72, GDX 44, etc)


Friday, March 19, 2010

Another overshoot strategy example

We had on watch-list at the 200SMA at 38. Stock based right on the number (not what you want if you are looking for support reversal) broke through but hit secondary support and found footing. Entry is on a lift-off from that area (37.55-37.64 average fills) for a day-trade back into primary support as a target (38) for at least partial sale.

Thursday, March 18, 2010

Overshoot Strategy

There's a certain trade we call "Overshoot strategy" that we'd like to discuss today. It's what we look for when we are looking to buy support and the stock goes right through our alert at primary support like a knife through butter. We always wait for some kind of reversal before we enter support (at least for day-trades). If the stock grinds through primary support without any kind of reaction from buyers then go back to the daily chart and look at secondary support. Often a stock that has gone through primary support finally finds footing on secondary support. First target for day-trade is a move back up to the first support. The reason we're writing about this now is because of two examples that showed up today:

DVN was on our watch-list for a possible support buy at the 200 SMA near 66. The stock didn't even hesistate at the number and showed no signs of reversal until it hit the secondary support near 65. Entry would be on reversal off 65 with stop under.


MOS went through the 50SMA without any problem but finally found footing on secondary support of 59.17.


If a stock/sector you are watching for support goes through primary support with ease then go through the daily chart again and set new alerts at secondary support. Chances are that the new alert will develop into a decent trade. As always, wait for the reversal at a level found on the daily chart before entering. We never enter in no-man's land.

Wednesday, March 17, 2010

Market Talk

From our newsletter tonight:


Some decent break-out action today. Even though it was a good day we could have traded better. Simply put: we over-traded today: a consequence of trading nervously. But we had good reason given that the SPY is up 14 days in a row (previous record was 12). End of day action was sloppy and we expect market to be difficult going forward, at least short term. This is our plan for tomorrow: we're short SPY 117. If we add longs then we will keep it as a hedge. If we don't add any longs then we'll probably give it 50 cents before taking the loss, depending on market action (and breadth -- if spike up to today's highs with mixed breadth then we'd probably add and not bail).

----
We still have a few non-extended long set-ups we like for tomorrow. If the market melts up most likely we'll be involved with those and just leave the SPY short on as a hedge.

For very active traders like ourselves the GS AAPL and metal reversals today were enough of a warning sign for us to retreat back into a more conservative mode. For longer-term swing traders there still is no confirmation to head for the exits (but raising some cash at these levels makes a lot of sense).

Nice breakouts

Extended market, SPY already up record days in a row, yet, yet, yet a lot of nice break-outs. As we wrote last night, "Statistically speaking it would be hard to believe that tomorrow will be green, however, set-ups for us always trump everything else. If it sets with volume, take it. Otherwise, step back and wait for market to catch its breath."

Here is what triggered from yesterday's list

We're out most of all of the following but will swing last partial if the stocks can hold on to the gains. We had a SPY hedge but let go of that due to commodity stocks acting well and due to the small size left in our positions. Update: We sold everything on the weak action on GS AAPL. We're all cash.

Line represents the alert:

GMCR was the only one not in the newsletter but we called out the 95 breakout real-time today in Twitter