GDX today bounced on the trend-line. We hope it's temporary and that there will be a test of the 200 SMA/daily support near 41-41.5.
We would also love a pull-back to GLD from 104-100.
An educational blog which supplements subscriber service Chart Patterns are nothing but Footprints of the Greenbacks.
Friday, December 18, 2009
Natural Gas
Natural Gas is like the wild, wild West of energy and investing in it can be tricky. We prefer to invest in natural gas companies than the commodity or heaven forbid, the ETF (UNG).
Here is a handy chart that tells the tale well comparing an ETF invested in natural gas companies (FCG) to natural gas futures (pink line) and the contango-suffering natural gas future ETF UNG (purple line).
We don't want to chase price up at this point and are waiting for a pull-back to get into some natural gas companies (LINE PXD FST EOG SWN APC, etc). We are admittedly late to this party (ok, very late -- our focus has been oil and not natural gas) but we would be interested in buying pull-backs to support in this sector. Some would argue that the divergence between the commodity and the stocks at this point illustrates that one should sell the stocks and buy the futures but we'd rather take our chance with buying the stocks on support.
SPY test
Today we finally had the 50 SMA/bottom of channel test that we've written about -- this is the level that has to hold for the bulls.
Considering the number of sectors considerably off their highs the S&P 500 (think financials and energy to start) this resilience is impressive.
Thursday, December 17, 2009
Trading Talk
We are aggressive momentum traders when a market is coming off a bottom, or one which we feel still has a lot of room for upside.
However in a market which has rallied as much as this one we prefer to wait for a pull-back to support before entering instead of buying new highs.
Momentum trading is more active for us as one alert after another goes off. Support buying on the other hand means one has a lot more time on one's hand (sometimes the more difficult of the two) and has be patient and wait for the trade to pull-back to one's target entry point.
These are the type of set-ups we've had in the newsletter the last few weeks and the type of set-ups we will be looking for in the near future. As an additional note -- support buying lends itself more to swing-trading than day-trading and going forward we're going to have selections such as these as swing trades.
Deeply oversold stock in a bull market, falling into support, is often one of the most successful swing set-ups:
Arrow points to the buy point featured in the newsletter:
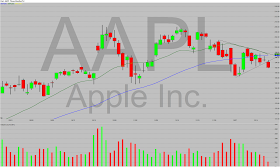
AAPL
From a short-term perspective AAPL looks vulnerable with first real support at the 185 area. We'd be buyers of the 185 support for a trade.
From a longer-term perspective we wouldn't touch AAPL long until the trend-line is broken to the upside:
Wednesday, December 16, 2009
Fumes
We're not smart enough to be anticipatory traders -- we are nothing but your classic trend-traders. The current trend is up meaning every day we look to buy break-outs and support longs. But at the same time we look at the following chart and understand what the bears see and the potential for the pull-back. We will trade long for as long as the good times last but at the same time we'll be more careful going forward with buying support.
The 1 year chart looks vulnerable:
The short-term chart shows the market stuck in a channel between SPY 112-109 -- note how the 50 SMA has caught up to the bottom of the channel.
The 1 year chart looks vulnerable:
The short-term chart shows the market stuck in a channel between SPY 112-109 -- note how the 50 SMA has caught up to the bottom of the channel.
Tuesday, December 15, 2009
GS trend-line
Volume is light and the market is still stuck in the range (USD rallying not helping). We've been knocking around 15-20 cent trades today which is somewhat pathetic but at least pays some bills. Without volume there is no good intraday movement for our stocks. If the volume is going to remain this low for an extended period of time then it will force us to look more and more toward swing trading. Our entries for our newsletter alerts are based on daily charts so swing-trading the picks would come naturally.
Keep an eye on GS in the near future and the trend-line currently near 168 if we rally. If we sell-off then first support is around 157 and then comes the 200 SMA near 151. We'd probably day-trade long the 157 support but would be interested in swing-long off the 200 SMA.
Monday, December 14, 2009
Test of Range
Finally some volume coming into the market with news on the Abu Dhabi bailout of Dubai and XOM buying XTO.