An educational blog which supplements subscriber service Chart Patterns are nothing but Footprints of the Greenbacks.
Saturday, August 05, 2006
Our Links
On the bottom right-hand side of our blog you will find a section called "Blogs we Like". These include blogs that have excellent real-time information about what is happening in the market, such as Knight Trader, The Kirk Report, Maoxian and Trader Mike; blog writers who share their daily journeys (and which include some great wacky personalities)such as Ugly Chart, Trader X, Move the Markets, and Newb Trading ; and others who trade in a similar fashion to us like Bull Trader,
The Wall St. Warrior, and
Downtown Trader. We also have added a great new little service called
Instant Bull which allows you, among other things, to quickly look up relevant information about your stock (information that we like to check, such as earnings date, float information, historical data information), check out news, and peruse 30 excellent blogs in one screen. Check out our links; you'll find them to be useful shortcuts in the dizzying world of online financial information.
Wednesday, August 02, 2006
Three great ways to trade around our numbers
We wanted to discuss today the various ways you can use our entry prices; numbers which are always representative of an important spot, be it resistance, break of downtrend line, etc, and which often act like magnets for stocks.
A: The first and most common way is to simply wait for the set-up, check to see if the intraday conditions are fulfilled, and if affirmative, enter through the confirmation number.
B: The second way, is to do a reverse trade IF the intraday conditions are NOT fulfilled. For example, we list stock HCPG as having formidable resistance at 100. The stock approximates our number in a sloppy way with very light volume and for these reasons you know that there is no way you will buy the stock as there is a high chance of failure. The best trade here would be to short the stock, close to resistance, with a stop right above.
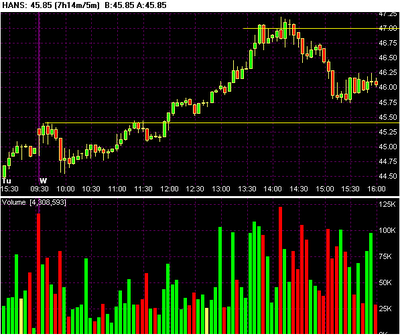
C: The third way is one that is slightly trickier but that often works well. However, we would recommend this only be used for more experienced traders. As you know we often have written that the most successful way to trade is to wait for the daily and intraday charts to coincide. What does this mean? This means that the intraday chart also bases near the listed entry price, thereby also printing a nice pattern. Now, the third way to use our entry prices is as price targets. Sometimes what occurs is that a stock fulfills all the intraday conditions (great volume, relative strength, and basing nicely), BUT is doing all this a few percent away from our listed entry price. The stock then proceeds to break this nice base with good volume. We often are buyers of these breaks, and ride the stocks up in their subsequent vertical moves until the stock actually reaches our own entry price. Usually that is the time to sell most of the position (we keep a little just in case it has enough momentum to go through, however this usually does not happen). Why sell? Because a stock that has just ran a point usually is very low on steam and is not in a position to break resistance. This is the reason we repeatedly tell our readers to never buy on top of a vertical move. Let's use two examples. The first one you will recognize from a UARM trade from a couple weeks ago that we had listed as a buy through 43.5. She based very nicely at 42.6 and then broke the base with volume and ran EXACTLY to 43.5. The second example was from HANS today. We had listed 47 HANS two days ago.
42.6 was an absolute beautiful base in UARM, with a positive break coming with a volume spike. The trade was from the break of the base to resistance at 43.5.
The second example, HANS, based today very nicely at 45.4 with heavy volume and excellent relative strength. The second possible entry was 45.8. The target? Our own listed price of 47 (which was resistance).
Sometimes, especially in low-volume summer trading, momentum trading does not function very well. In these occasions, one can resort to methods B and C more often. However, we should add that if you find all this confusing, no worries, be extra patient, and stick to method A, which is sufficient to earn a good living in the long run.